Erythropoietin (EPO) - Detection Method

The current method for detecting EPO approved by the World Anti-Doping Agency (WADA) involves the direct detection of EPO in urine or blood.
Genetically engineered EPO preparations (recombinant EPO) differ from EPO (endogenous EPO), which is synthesized in the human body, due to a high degree of heterogeneity in the sugar chains. Differences are known to exist in the branching patterns of the chains, the number of terminal sialic acid groups, and the number of sulfate groups.
In addition, there are recombinant EPO preparations that exhibit differences in amino acid sequence (e.g., darbepoetin) or are additionally pegylated (conjugated with polyethylene glycol) (e.g., CERA). These differences can be analytically exploited using electrophoretic separation systems and utilized for differentiation in the detection of doping.
For electrophoretic methods, either the IEF method (isoelectric focusing), first introduced by Francoise Lasne for doping analysis, or the SDS-PAGE or SAR-PAGE method can be used. The latter two methods separate the different forms of EPO based on molecular size.
SDS-PAGE is the abbreviation for sodium dodecyl sulfate polyacrylamide gel electrophoresis;
SAR-PAGE is the abbreviation for sarcosyl polyacrylamide gel electrophoresis. PDF
download: Urine IEF method
___________________________________________________________________
IEF Gel (Example)
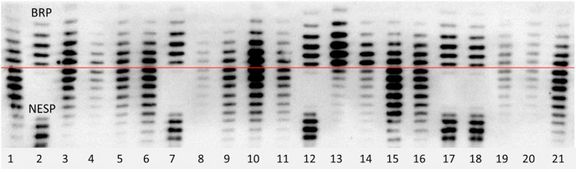
Lane 2, 7, 12, 17 - EPO reference standards BRP and NESP (darbepoetin)
Lanes 3 through 6, 8 through 11, 16, 19 through 21 - negative doping control samples
Lane 13 - positive QC (quality control, EPO RefStd BRP added to a urine sample)
Lane 14 - positive doping control sample (AAF, Adverse Analytical Finding)
Lane 15 - negative QC (quality control)
Lane 18 - stability test with the EPO reference standards BRP and NESP
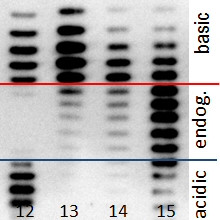
Interpretation of the Results
The inset on the right shows the samples from lanes 12 to 15 of the IEF gel above. A positive doping control sample is analyzed in lane 14. To evaluate the results, a line (red) is drawn across the entire gel below the lowest band of the EPO reference standard BRP (lanes 2, 7, 12, 17). The area below the red line is designated as the endogenous region (endogenous) and the acidic region (acidic, blue line), while the area above the red line is designated as the basic region (basic). If at least two of the bands above the red line (basic region) are more intense than the most intense band in the endogenous region, the sample is evaluated as positive. The evaluation is performed in accordance with the WADA Technical Document TD2014EPO.
SAR-PAGE (Example)
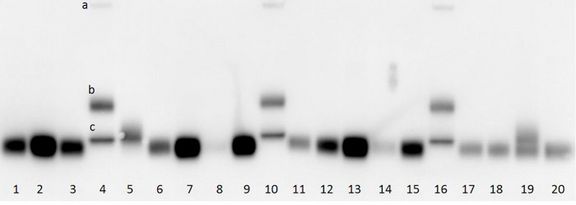
Interpretation of the Results
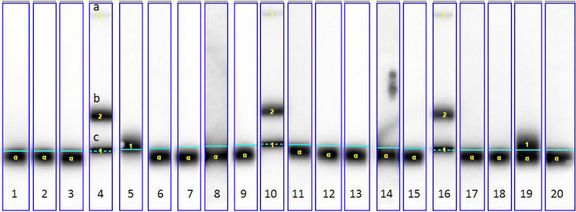
To interpret the results, the raw data file is processed using a certified analysis program (GASEPO), during which all bands are contrast-optimized. Using the Dynepo reference standards, a line (blue) is superimposed across the entire gel. All negative samples show signals below this line, while recombinant EPO preparations exhibit a signal above the blue line. In the positive doping control sample (Lane 19), a very broad signal is detected both above and below the blue reference line. This indicates that, in addition to recombinant EPO, traces of endogenous (endogenous) EPO are also present in the urine sample.
SAR-PAGE - GASEPO Analysis
References
Lasne F and de Ceaurriz J. Recombinant erythropoietin in urine. Nature, 405 (2000) 635
Article in Nature
Lasne F(1), Martin L, Crepin N, de Ceaurriz J. Detection of isoelectric profiles of erythropoietin in urine: differentiation of natural and administered recombinant hormones. Anal Biochem. 2002 Dec 15;311(2):119-26.
Abstract
Reichel C, Abzieher F, Geisendorfer T. SARCOSYL-PAGE: a new method for the detection of MIRCERA- and EPO-doping in blood. Drug Test Anal 1(11-12):
494-504 (2009)
Abstract
Reichel C. SARCOSYL-PAGE: A New Electrophoretic Method for the Separation and Immunological Detection of PEGylated Proteins. Methods Mol Biol. 869:
65-79 (2012)
Abstract
Reichel C., Gmeiner G. (2010) Erythropoietin and Analogs. In: Thieme D., Hemmersbach P. (eds) Doping in Sports: Biochemical Principles, Effects and Analysis. Handbook of Experimental Pharmacology, vol 195. Springer, Berlin, Heidelberg
Abstract