Testosterone - Detection


Determination of the testosterone/epitestosterone (T/E) ratio
The detection of the endogenous steroid hormone testosterone is performed in two steps:
1. GC/MS analysis and determination of the testosterone/epitestosterone (T/E) ratio.
2. Carbon isotope ratio mass
spectrometry (Gas Chromatography/Combustion/Isotope Ratio Mass Spectrometry - GC/C/IRMS)
- Since the late 1990s, the testosterone detection method has been validated by a direct determination method using 13C/12C isotope mass spectrometry. This isotope method is required as a confirmatory method.
See > Isotope Determination
______________________________________________________________________
For GC/MS analysis, testosterone is derivatized, yielding a bis-TMS derivative in quantitative form (Fig. 1 shows the corresponding mass spectra of free and fully trimethylsilylated testosterone).
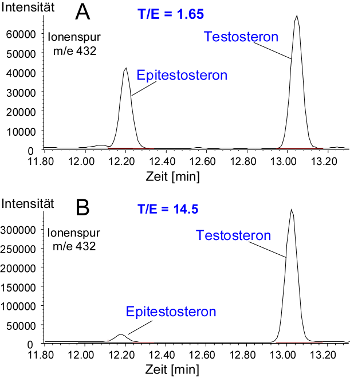
However, GC/MS analysis can only show that the isolated compound is testosterone; it cannot distinguish whether the testosterone was synthesized by the body itself or administered externally for doping purposes. To still be able to monitor the misuse of testosterone, Donike and Zimmermann determined the testosterone/epitestosterone ratio (T/E ratio) [1]. This revealed that this ratio remains relatively constant in an individual and only increases following testosterone administration. In this assay, epitestosterone, a stereoisomer of testosterone, can be used as a reference steroid, as it is not a direct metabolite of testosterone and does not increase upon testosterone administration. Fig. 2 shows GC/MS chromatograms of the testosterone determination. The MS spectrum records the molecular ion m/e 432. Fig. 2A shows the result of a negative sample with a T/E ratio of 1.65, and Fig. 2B shows a positive testosterone case with a ratio of 14.5.
Change since 2016
Since 2016, however, steroid profile data, including T/E ratios, have been recorded by the World Anti-Doping Agency (WADA) (transfer of doping control analysis data from laboratories to WADA’s ADAMS system). The data are then assigned to the respective athletes, and anomalies are recorded more effectively.
For further information, see Athlete Biological Passport - Steroid Module
Fig. 2 Determination of the testosterone/epitestosterone ratio: GC/MS chromatogram (ion trace m/e 432) A) of a negative sample with a T/E ratio of 1.65 and B) of a positive sample with a T/E ratio of 14.5, instrument: Hewlett-Packard MS 5971/GC 5890, Column: Hewlett-Packard, Ultra 1, 17 m, I.D. 0.2 mm, film thickness 0.11 µm, carrier gas: helium 1 ml/min split 1:10, temperature program: 180°C - 3°C/min - 230°C.
References:
1] Donike M, Bärwald K-R, Klostermann K , Schänzer W, Zimmermann J: Nachweis von exogenem Testosteron. In Sport: Leistung und Gesundheit (Hrsg. Heck H, Hollmann W, Liesen H, Rost R), Deutscher Ärzte Verlag, Köln, 1983, 293.